ArrayXPath
ArrayXPath: mapping and
visualizing microarray gene-expression data integrated biological pathway
resources usng SVG
Hee-Joon Chung,
Mingoo Kim, Chan Hee Park, Jihoon Kim and
Ju Han Kim*
Biological pathways can provide
key information on the organization of biological systems.
ArrayXPath (http://www.snubi.org/software/ArrayXPath/) is a
web-based service for mapping and visualizing microarray gene-expression
data for integrated biological pathway resources using Scalable
Vector Graphics (SVG). By integrating major bio-databases and
searching pathway resources, ArrayXPath automatically maps different
types of identifiers from microarray probes and pathway elements.
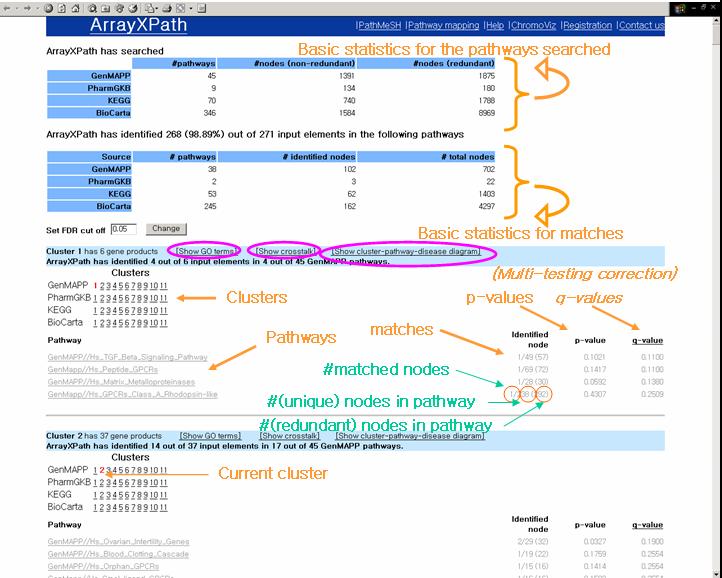
When one inputs gene-expression clusters, ArrayXPath produces a
list of the best matching pathways for each cluster. We applied
Fisher's exact test and the false discovery rate (FDR) to
evaluate the statistical significance of the association between
a cluster and a pathway while correcting the multiple-comparison problem.
ArrayXPath produces Javascript-enabled SVGs for web-enabled interactive
visualization of pathways integrated with gene-expression profiles.
 Nucleic Acids Research, 2004 Jul 1;32:W460-W464
ArrayXPath
Concept diagram of ArrayXPath
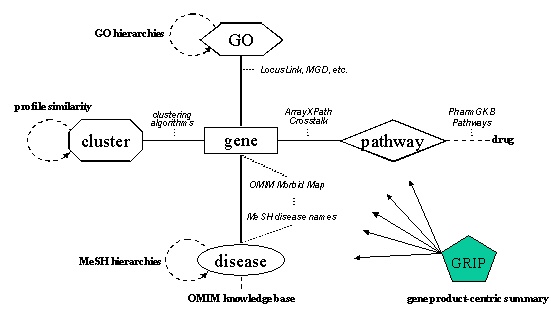
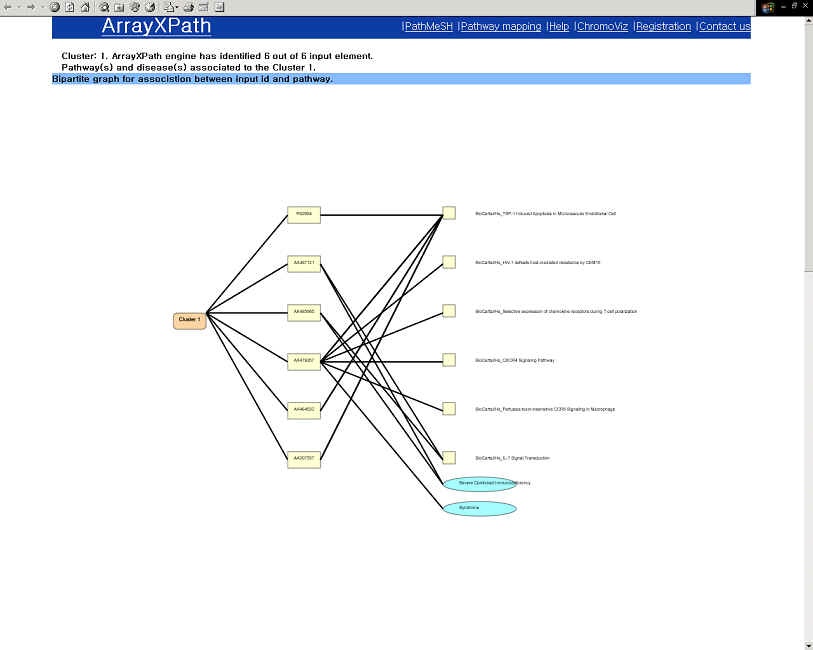
ArrayXPath integrates the quinta-partite graph structure of cluster, gene, disease, pathway and GO-term associations from multiple resources.
Input to ArrayXPath
Input to ArrayXPath is a common tab-delimited text file for a (clustered)
gene-expression profile:
<Probe ID>-<Cluster
ID>-[<Expression level at conditioni>].
- The first row must contain column heading (i.e., ID, ClusterID,
condition1, condition2, ...).
- The first column must contain either GenBank accession, UniGene ID,
LocusLink ID, SwissProt ID, TrEMBL ID, or official gene symbol. Affymetrix
probe identifiers can also be used.
- The second column has cluster IDs.
* When you also want to visualize
filtered-out profiles before clustering, put 'NA' as the cluster ID for the
filtered probes.
- The third to i-th columns are optional and contain expression
levels across experimental conditions.
ArrayXPath dose not perform cluster analysis. The input format is designed
primarily for partitional clustering algorithms (i.e., K-means and
Self-Organizing Maps) but clustering results from hierarchical algorithms (i.e.,
dendrogram) may be applied by choosing a threshold carefully.
How to use ArrayXPath
- Download and install
SVG Viewer plug-in
from Adobe.
(ArrayXPath has been tested in Adobe SVGViewer
3.0 and MS-Internet Explorer 5.0 or higher. MS-Windows XP users may not have
to install SVG plug-in.)
Submit your gene-expression cluster data (see input to
ArrayXPath). You can choose the correct taxonomy (i.e. Hs, Mm or Rn) and
statistical testing.
(The process is computationally expensive and may take several minutes depending on the input data
size.)
(Please try example data sets
below)
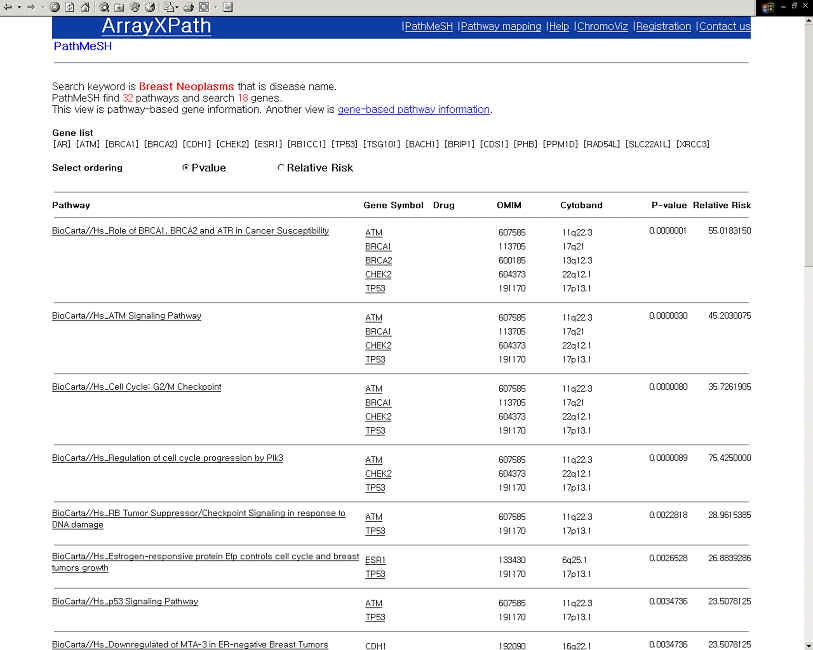
Browse the matched pathways with statistical scores
(i.e. p- and q-values).
Select the pathway of your interest.
| GO terms are enriched with a hyperlink to an GOChase-HistoryResolver
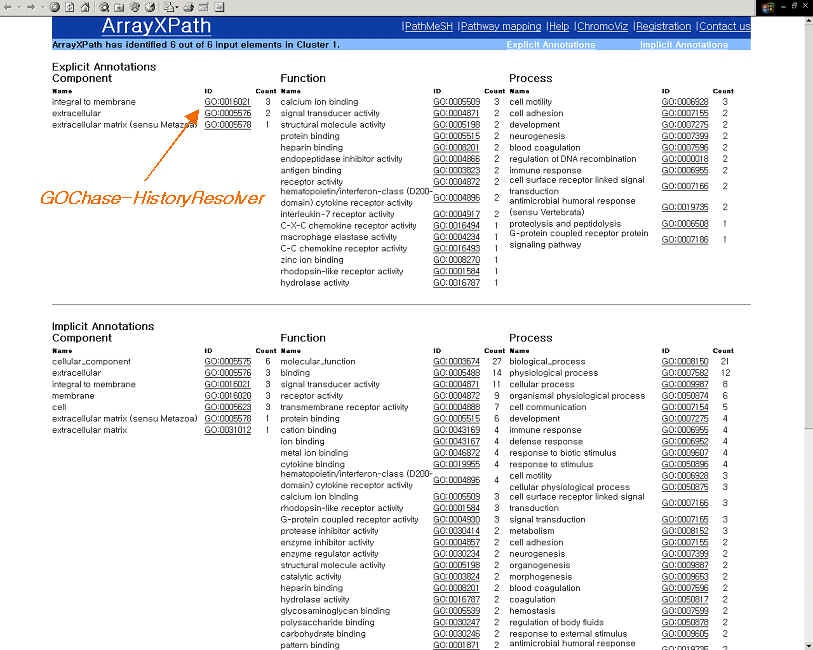
|
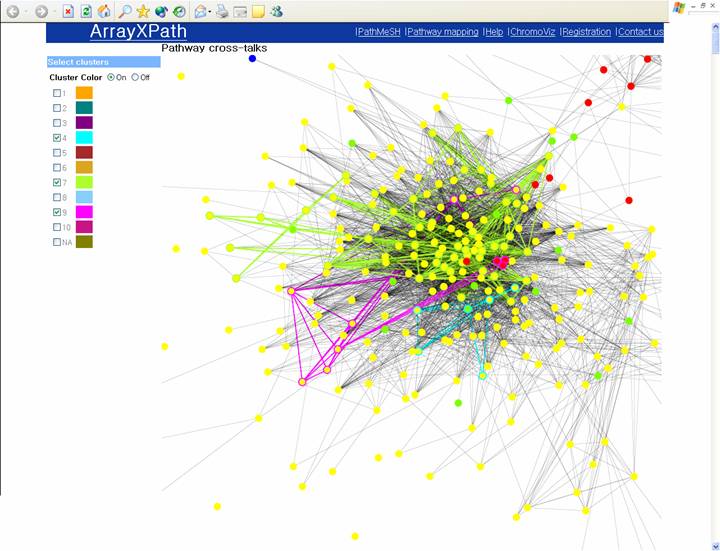
Pathway crosstalk (It should be performed after Fisher's exact testing or Fisher's exact testing with False Discovery Rate)
|
GO-based annotation and OMIM information (Homo sapiens only)
|
- Browse the pathway color-coded with
gene-expression levels.
- Example output:
Example 10 clusters
from the Human HeLa cell-cycle data analyzed by ArrayXPath.
- Browse the list of the pathways containing the disease-relate gene product.
(PathMeSH returns a list of disease-related pathways with statistical significance scores by integrating pathway resources, MeSH disease names, and OMIM Morbid Map.)
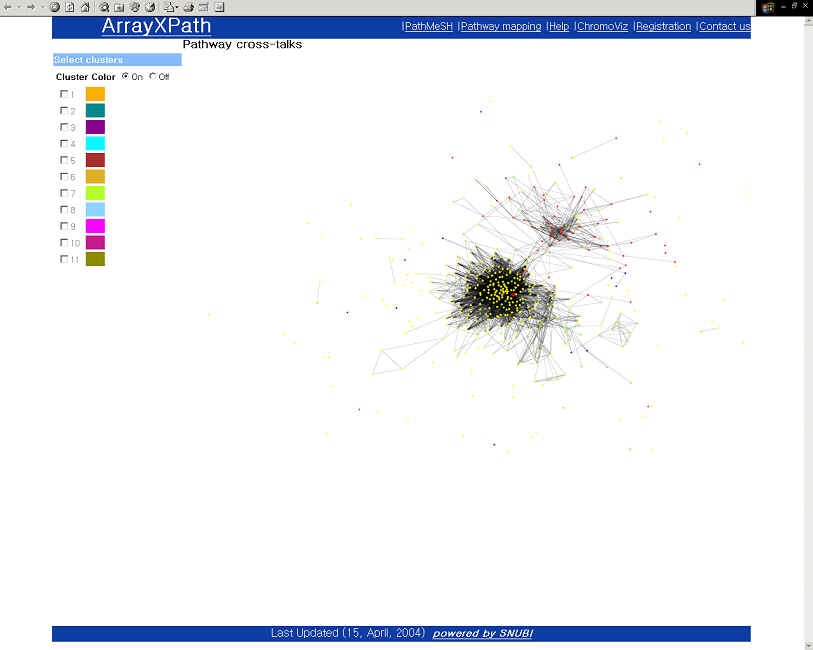
Browse a broad view of pathway crosstalk clustering patterns within a cluster.
(Visualize the clustering patterns above certain significant threshold.)
Upload
your expression profile to find the best matching pathways!
10 clusters
from the Human HeLa cell-cycle data analyzed by ArrayXPath.
100 clusters from the Human HeLa cell-cycle data analyzed by ArrayXPath.
50 clusters from the Mouse kidney data analyzed by ArrayXPath.
Example input datasets
-
One can download one of the example files and submit it to
ArrayXPath. (Whitfield ML et al. 2002)
Hs. HeLa cell-cycle data set clusters 1, 2, 3, 4, 5, 6, 7, 8, 9,10, NA (to
save time).
We
separated each cluster just because it may take more than 10 minutes to
analyze the whole set.
The whole set containing multiple clusters,
however, can be input as a single file. 'NA' means the filtered-out
probes, which is useful in lightening
the background nodes of pathways.)
Human HeLa Cell Cycle data set with 6 clusters containing 1,019
(filtered) genes. (Whitfield ML et al. 2002)
Mouse
anti-GBM IgA nephropathy model (50 clusters containing 1,112
(filtered) genes). (Ref.)
Our dataset submitted to Gene Expression Omnibus
(http://www.ncbi.nlm.nih.gov/geo/) under accession numbers
GSM15078-GSM15092, GSE954-GSE958, and GSE969.
powered by SNUBI