Download TRAPR Package for linux
Download TRAPR Package for Mac os
Download TRAPR User's Guide
Download TRAPR R Reference Manual
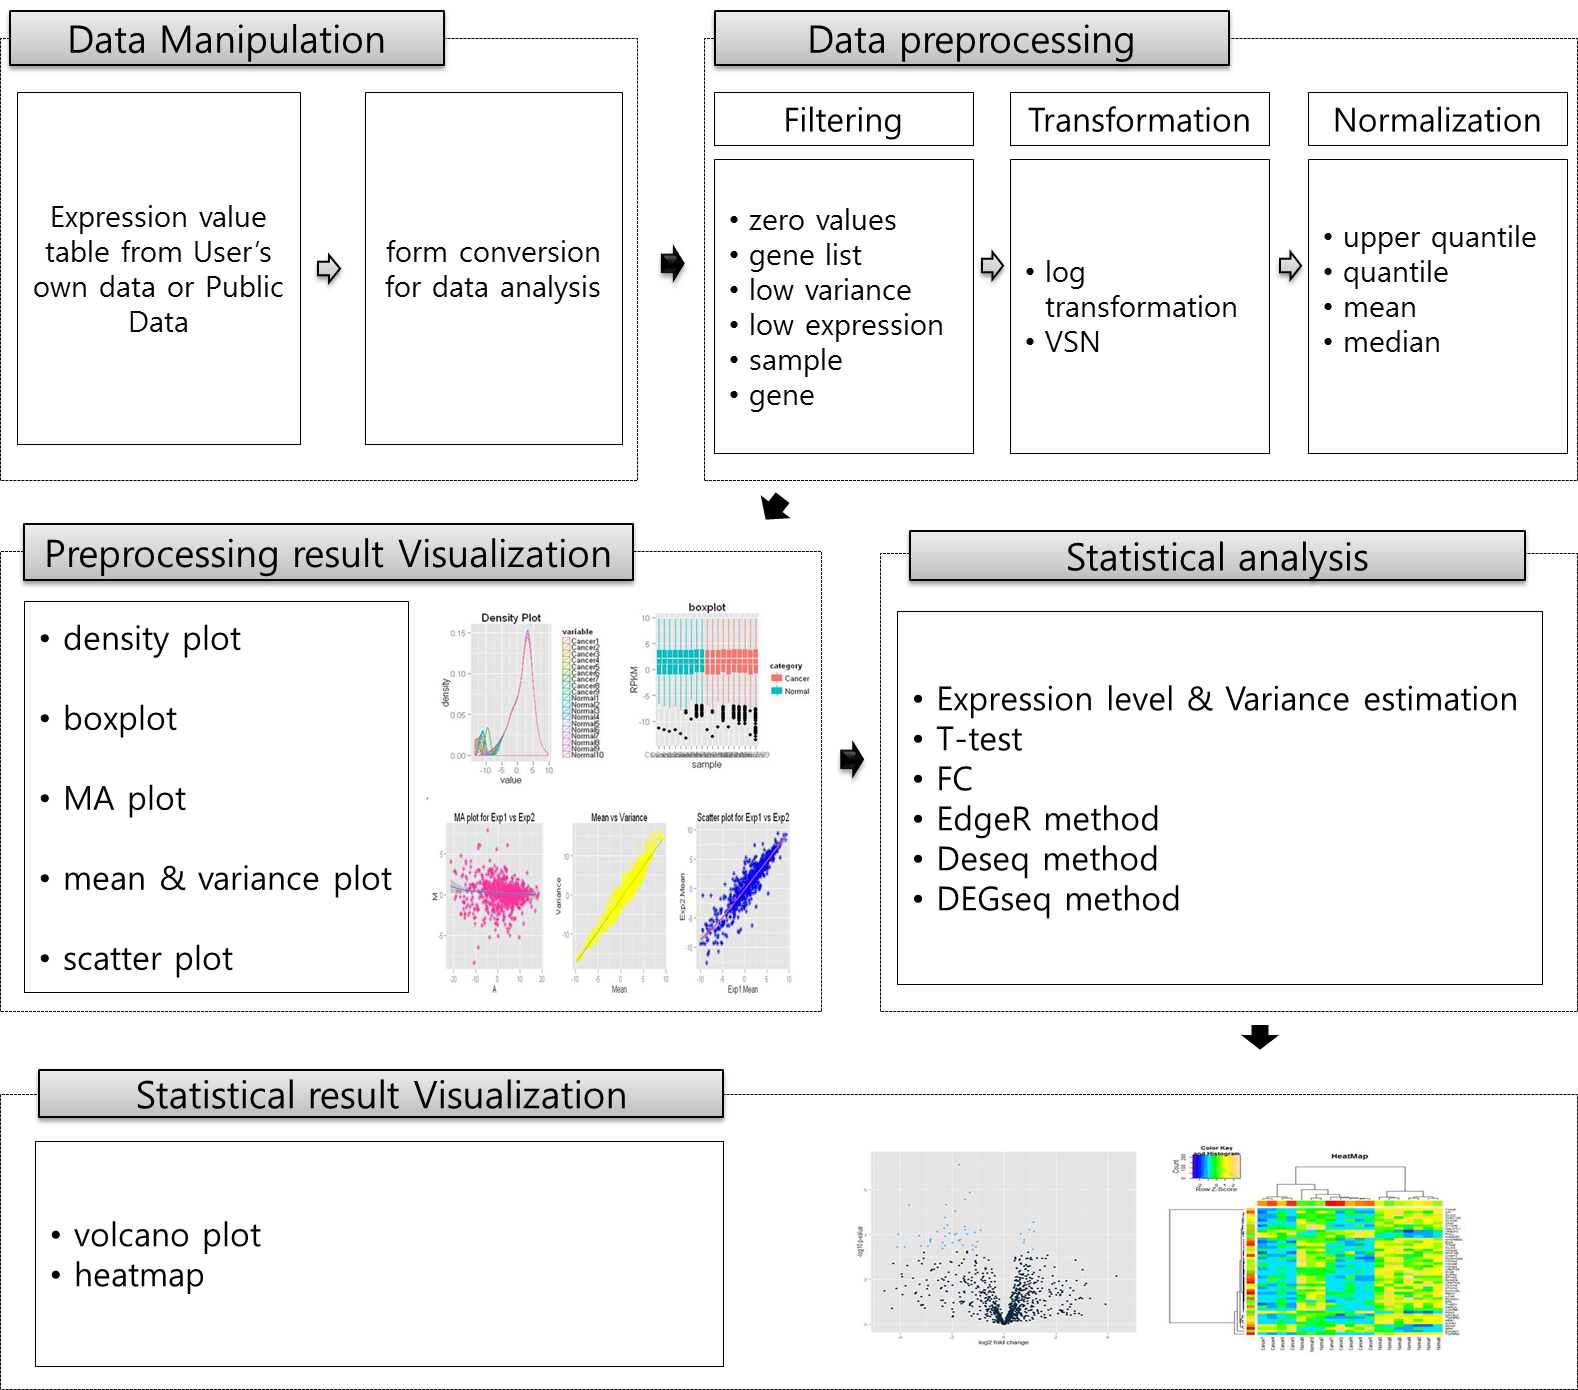
TRAPR is R based RNA-Seq analysis pipeline. Fig0 present RNA-seq data analysis pipeline of TRAPR.
Start TRAPR
1 Set up TRAPR package in your R
2 Previous set up packages
3 Loading TRAPR package
4 Format of input file
5 Sample data
6 Start TRAPR analysis
6.1 Data Manipulation
6.2 Filter
6.3 Normalization
6.4 Data Visualization
6.5 Statistical Test
6.6 Result Visualization
6.7 Out-print of DEG Result file
* Our manual was made based on window 7
1 Set up TRAPR package in your R
Download TRAPR package and install
Download TRAPR package and install
| 2. Previous set up packages |
|---|
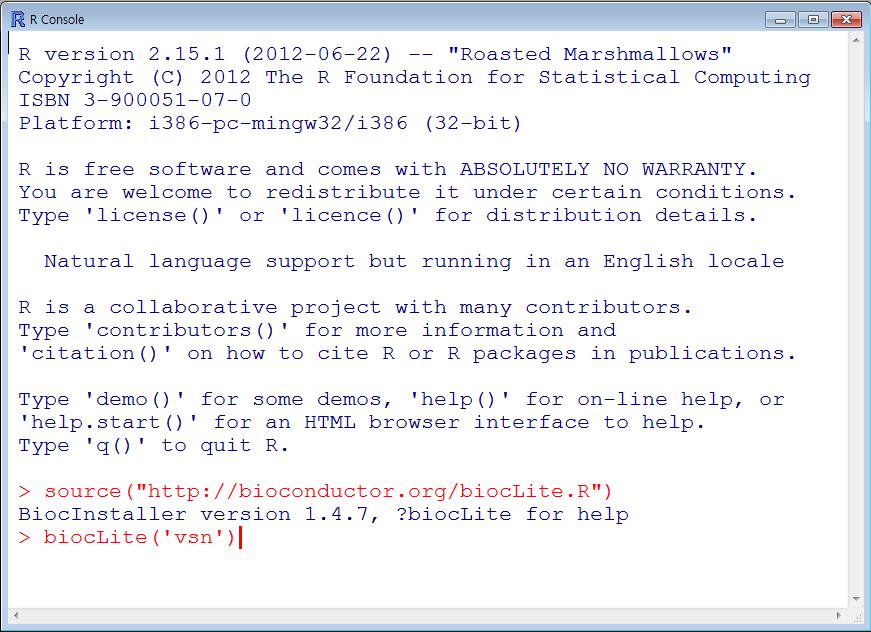
| TRAPR must be needs some R packages(vsn, preprocessCore, edgeR, gridExtra, ggplot2, reshape2). We will show description of package setup method. For example, we explain vsn. |
|
|
|
| Fig1 Dependent packages installation |
|
|
|
> biocLite('vsn')
> biocLite('preprocessCore') > biocLite('gridExtra') > biocLite('ggplot2') > biocLite('reshape2') |
| 3. Loading TRAPR package |
|---|
|
|
|
> library(TRAPR)
|
| 4. Format of input file |
|---|
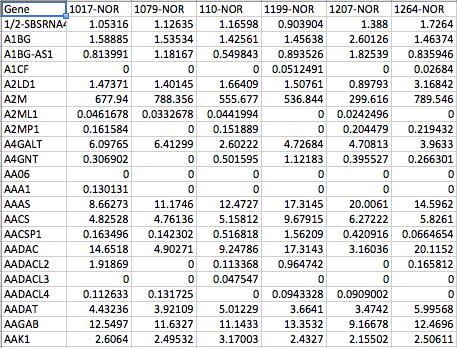
| TRAPR input file consist of Tab-deliminated text file. Column is sample list. Row is gene list. Each cell is filled gene expression values(Fig2). |
|
|
|
| Fig2. input format of TRAPR |
|
|
| 5. Sample data |
|---|
| Our sample data file name is 'sample.txt'. This file contained in TRAPR. The origin of sample.txt is breast cancer data from TCGA. It consist of 9 normal tissue cancer sample and 10 cancer sample using RNA-seq technology and It¬Ó¬ŕ?s value is FPKM(Fig3). |
|
|

|
| Fig3 sample.txt in TRAPR |
|
|
| 6. Start TRAPR analysis |
|---|
| 6.1 Data Manipulation |
|
|
|
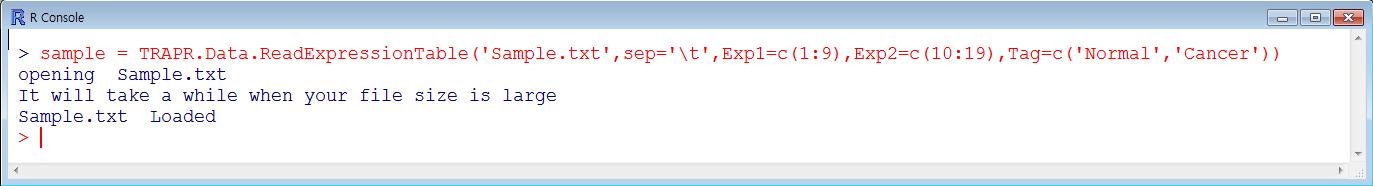
> Sample <- TRAPR.Data.ReadExpressionTable('sample.txt', sep = '\t', Exp1 = c(1:9), Exp2 = c(10:19), Tag = c('Normal', 'Cancer'))
|
|
|
| Function loading sample file is TRAPR.Data.ReadExpressionTable. The code component explain showing Fig3. More Information in reference manual. |
|
|
| Fig4 sample loading code & example |
|
|
| Sample position (green color) is description for sample column position. Tag (blue color) is description for sample labels. Loaded sample data is saving 'Sample' value and after using function of filtering and normalization. More Information in reference manual. |
|
|
| 6.2 Filter |
|---|
|
|
|
|
| Fig5 Zero value filtering function code & example |
|
|
|
|
| 6.3 Normalization |
|---|
|
|
|

|
| Fig6 Normalization function code & example |
|
|
|
|
| 6.4 Data Visualization |
|---|
|
|

|
|
|
|
| Fig7 Data visualization function code & example |
|
|
|
| Fig8 Result example plot of data visualization |
|
|
|
|
| 6.5 Statistical Test |
|---|
|
|
| TRAPR provide 4 method for statistical test ('ttest', 'wilcoxon', 'edgeR', 'FC'). If you needs another function, just write method name replace ' ttest '(purple color). TRAPR also provide adjust test method('holm', 'hotchberg', 'hommel', 'bonferroni', 'BH', 'BY', 'fdr', 'none'). |
|
|
|
|
| Fig9 Result visualization function code & example |
| 6.6 Result Visualization |
|---|
| TRAPR provide Result plot of after statistical test. We provide 2 kinds of plots (Heatmap, volcano plot)(Fig11). |

|
|
|
|
| Fig11 Result example plot of result visualization |
|
|
|
| Fig11 Result example plot of result visualization |
|
|
| 6.7 Out-print of DEG Result file |
|---|
| TRPR provide out-print your DEG result file in your directory. User just typing file name(blue color) in code. |

|
|
|
|
| Fig12 Out-print of DEG Result file function code & example |