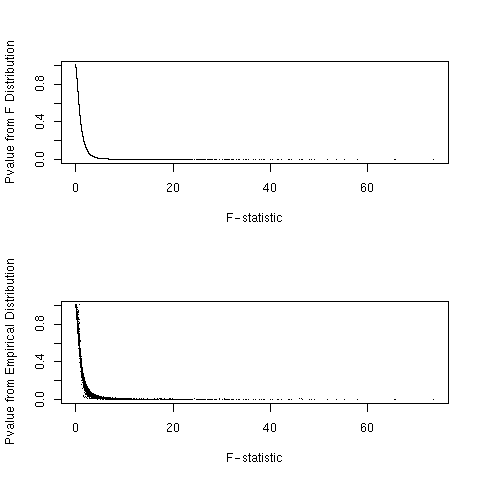
plotted against the observed F-statisics.
permutation. The peak around 0.38 comes from the Fiducial probes
spiked onto the array as controls.
probe. Dots are deviated from the theoretical line(red).
rejected probes.
|
| Figure 1.
P-values from both theoretical and empirical distribution are plotted against the observed F-statisics. |
|
|
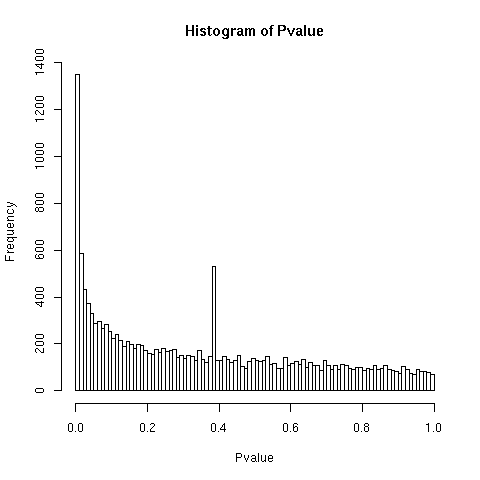
| Figure 2.
The frequencies of P-values obtained from the 100,800 permutation. The peak around 0.38 comes from the Fiducial probes spiked onto the array as controls. |
|
|
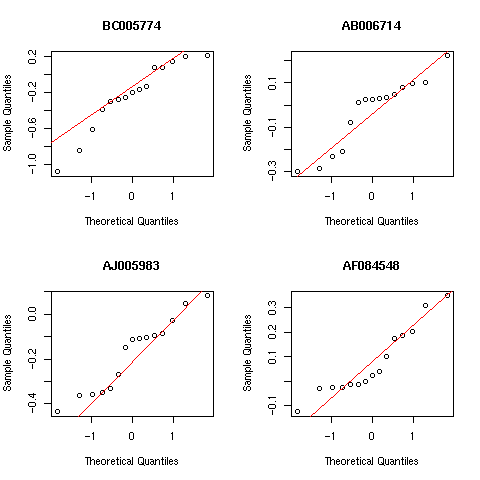
| Figure 3.
Sample quantiles are plotted against theoretical quantiles for each probe. Dots are deviated from the theoretical line(red). |
|
|
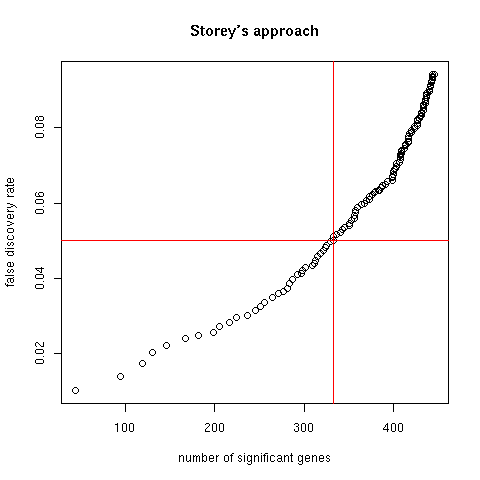
| Figure 4.
False Discovery Rate is plotted against the corresponding number of rejected probes. |