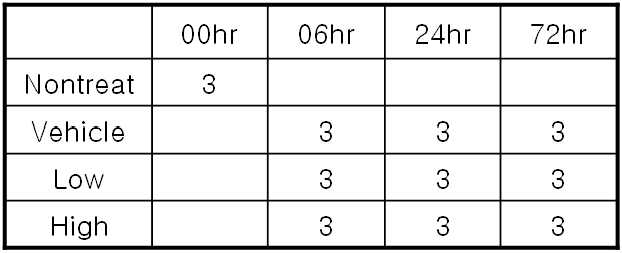
Array: Applied Biosystems AB1700 mouse chip (33315 probes)
30 arrays in total with triple biological replicates
Comprehensive analysis of differential gene expression profiles on diclofenac-induced acute mouse liver injury and recovery
Heekyoung Chung,a Hyun-Jun Kim,a Ki-Seok Jang,a Mingoo Kim,b Jungeun Yang,c Ju Han Kim,b Yong-Sung Lee,c and Gu Kong a,*
Affiliation and Addresses:
a Department of Pathology, and c Department of
Biochemistry, College of Medicine, Hanyang University, Seoul 133-791, Republic
of Korea;
and b Seoul National University Biomedical
Informatics (SNUBI), Seoul National University College of Medicine, Seoul
110-799, Republic of Korea
*Corresponding Author.
Department of Pathology, College of Medicine, Hanyang University, 17
Haengdang-dong, Seongdong-gu, Seoul, 133-791, Republic of Korea.
Tel:
+82-2-2290-8251, Fax: +82-2-2295-1091, E-mail address: gkong@hanyang.ac.kr (G.
Kong).
Key Words: diclofenac; mouse; liver; toxicogenomics; Applied Biosystems Mouse Genome Survey Microarray
Abstract
Microarray analysis of RNA from diclofenac-administered mouse livers was performed to establish a global gene expression profile during injury and recovery stages at two different doses. A single dose of diclofenac at 9.5 or 0.95 mg/kg body weight was given orally, and the liver samples were obtained after 6, 24, and 72 h. Histopathologic studies enabled the classification of the diclofenac effect into injury (6, 24 h) and recovery (72 h) stages. By using the Applied Biosystems Mouse Genome Survey Microarray, a total of 7,370 out of 33,012 (22.3%) genes were found to be statistically reliable at p < 0.05 by 2-way ANOVA, and 602 (1.8%) probes at false discovery rate < 5% by Significance Analysis of Microarray. Among the statistically reliable clones by both analytical methods, 49 genes were differentially expressed with more than a 1.625-fold difference (which equals 0.7 in log2 scale) at one or more treatment conditions. Forty genes and 2 genes were identified as injury- and recovery-specific genes, respectively, showing that most of the transcriptomic changes were seen during the injury stage. Furthermore, multiple genes involved in oxidative stress, eicosanoid synthesis, apoptosis, and ATP synthesis showed variable transcript levels upon acute diclofenac administration.
1. Experimental Design
Array: Applied Biosystems AB1700 mouse chip (33315 probes)
30 arrays in total with triple biological replicates
2. Data
2.1. Raw data
2.2. Normalized data
Download normalized data (33315 probes x 30 samples)
Data are normalized in following procedure.
- Assay Normalized Signals are used.
- Only probes with Flag < 100 are used.
- Missing and filtered valued are imputed with KNN imputation algorithm.
- Values are VSN transformed.
- Arrays are scaled with quantile normalization.
- Normalized valued are rescaled with
3. Diagnostic Plots
3.1. Single-chip diagnostic plots
| Name | Analysis |
| DIC_Nontreat_NA_1 |
 |
| DIC_Nontreat_NA_2 |
|
| DIC_Nontreat_NA_3 |
|
| DIC_Vehicle_06hr_1 |
|
| DIC_Vehicle_06hr_2 |
|
| DIC_Vehicle_06hr_3 |
|
| DIC_Vehicle_24hr_1 |
|
| DIC_Vehicle_24hr_2 |
|
| DIC_Vehicle_24hr_3 |
|
| DIC_Vehicle_72hr_1 |
|
| DIC_Vehicle_72hr_2 |
|
| DIC_Vehicle_72hr_3 |
|
| DIC_Low_06hr_1 |
|
| DIC_Low_06hr_2 |
|
| DIC_Low_06hr_3 |
|
| DIC_Low_24hr_1 |
|
| DIC_Low_24hr_2 |
|
| DIC_Low_24hr_3 |
|
| DIC_Low_72hr_1 |
|
| DIC_Low_72hr_2 |
|
| DIC_Low_72hr_3 |
|
| DIC_High_06hr_1 |
|
| DIC_High_06hr_2 |
|
| DIC_High_06hr_3 |
|
| DIC_High_24hr_1 |
|
| DIC_High_24hr_2 |
|
| DIC_High_24hr_3 |
|
| DIC_High_72hr_1 |
|
| DIC_High_72hr_2 |
|
| DIC_High_72hr_3 |
|
3.2. Between-chip diagnostic plots
[View between-chip diagnostic plots]
- Boxplots(1~3) show intensity distribution of 30 arrays at each normalization step.
- Scatterplots(4~18) show intensity relations between 30 arrays at each normalization step (6 arrays in each panel).
- MVAplots(19~38) show M and A relationship between 30 arrays at each normalization step (3 arrays in each panel).
4. Differentially Expressed Genes (DEGs)
4.1. Lists of DEGs
4.2. SOM clustering and Gene ontology and pathway functional enrichment study
SOM clustering was performed on each ANOVA group. Then Enrichment study using
Gene ontology and pathway information was performed on each
cluster.
Broken line graphs show general tendency of expression profile for each cluster.
(Installation of SVG
viewer under Internet Explore is requiered.)
P-value < 0.05
MTC MDTI MDTx MDxI MDxx MxTI MxTx MxxI Mxxx UN 176 C A 470 C A 117 C A 547 C A 746 C A 4803 C A 408 C A 103 C A BF 0 C A 0 C A 0 C A 0 C A 0 C A 371 C A 0 C A 0 C A BH 0 C A 0 C A 0 C A 0 C A 0 C A 2916 C A 0 C A 0 C A BY 0 C A 0 C A 0 C A 0 C A 0 C A 1220 C A 0 C A 0 C A D = Dose
T = TimeClick C for Cluster viewer, GO enrichement analysis
Click A for ArrayXPath, Pathway enrichment analysis
UN = Unadjusted
BF = Bonferoni multiple test correction
BH = Benjamini :: Hochberg multiple test correction
BY = Benjamini & Yekutieli multiple test correction
Last updated: 2006-05-25